How to solve the tasks and why that way are discussed here. There are at least two challenges in two tasks:
- Too many missing days distribute differently among units.
- All series are non-stationary because of non-business-days, long-term trends, and seasonality.
The distribution of missing entries can be summarised as:
- For households 162, 428 and 432, two entries in different sets of dates are missed".
- For all the other households, 48 entries in different sets of dates are missed.
- There are only 186 time points when data is complete.
1. Clustering
Why not k-Means
Missing entries must be filled with meaningfull values first, or algorithms, like k-Means do not work. Clearly, neither to fill with 0 nor to interpolate is a good choice in terms of time series.
Monte Carlo simulations can be used, but the resulted effect is not known. The argument is that most clustering algorithms rely on calculation of cluster centres, which involves multiple units at the same time. Nevertheless, the joint set of missing days from those units might be large compared to that from pair-wise units, so simulated entries exist in more time index, distorting cluster centres.
Why not Agglomerative Hierarchical (Single Linkage)
Agglomerative hierarchical clustering (AHC) using single linkage relies on some distance matrix resulted from original data only. Entries in such distance matrix measure the similarity of some unit pair according to a pre-defined criterion. For similarity between time series, Pearson correlation, instead of Euclidean distance, is usually used.
When number of clusters is set to 4, for example, differences in sizes -- 497, 1, 1, 1 respectively -- are significant. The reason is that units in last three clusters do not have strong correlation with any other unit. That is, they are outliers. Though their distribution among clusters does not have a huge impact, they prevent the algorithm to process units in the first big cluster.
My Approach: Max Spanning Tree on Distance Matrix
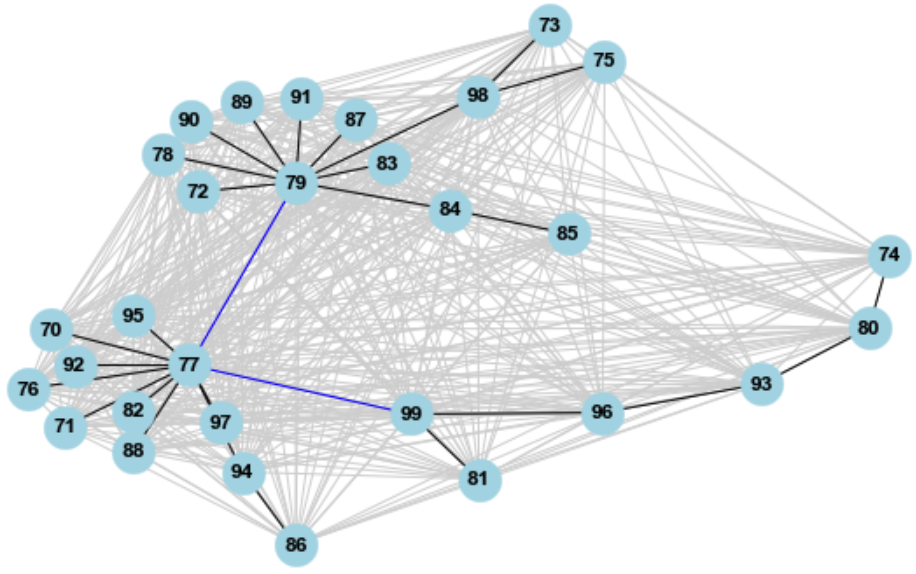
AHC using single linkage is an optimisation problem in essence. To run max spanning tree on distance matrix yields better result, actually. Another advantage of this approach is that the complete graph (with lightgrey-coloured edges in the following figure), which represesnts the distance matrix, provides a more intuitive way to choose clusters.
Units 70 ~ 99 are considered in the following example, resulting a clearer figure:
- The max spanning tree of the complete graph is highlighted by black edges.
- 77 and 79 have high degrees, and can be seen as representative units for two clusters.
- It seems to be a good idea to have another cluster, represented by unit 99.
- Weakest links between such three units (two blue edges) are found. If they are removed, the tree becomes a forest with three components, which correspond to three clusters.
Examine Clustering Results
Most methods to validate cluster results are based on original data, so they cannot be used, either. Probably the only option left is to validate based on pair-wise similarity measures, like Euclidean distance and Pearson correlation.
The distance matrix can be sorted according to clusters. Correlations between members within clusters are supposed to have higher values. In constrast, off-diagonal block matrices represent inter-cluster correlations, which should be low and even negative.
Clustering results based on hourly profiles and on daily profiles. Three symmetric metrics, adjusted Rand index, adjusted mutual information, and normalized mutual information are used to quantify difference between two sets of clusters. It shows that clusters are quite different.
2. Regression
Why Facebook Prophet
Prophet is an open-source package for modelling and forecasting univariate time series by Facebook. Its model structure is similar to that of generalised additive models (GAM), where distinct non-linear terms are integrated in a linear way. Prophet works best when the series shows strong and multiple seasonality, and it is robust to missing values and effect from holidays, making it the perfect choice in our case.
My Approach: Seasonal ARIMA
It is impossible to plot ACF and PACF for original series because of missing entries. As discussed before, they are adjacent so it is hard to fill with meaningful values. Result from Prophet provides a starting point. To have a weekly season is a good idea, and it should be "integrated", in order to remove the long-term trend. An integrated SARIMA (with AR1, MA1 and weekly seasonal AR1) structure is used for all daily profiles.
There are daily and weekly seasonal components in hourly profiles, which cannot be modelled by any seasonal ARIMA at the same time. So it cannot be used.
Model Validation
There are systematic ways for validation. It is challenging to conduct a cross validation for time series models, especially when there is long-term trend. Pseudo out-of-sample validation is used instead. Validation results show that seasonal ARIMA is good enough for daily profiles, compared to Prophet.
Results
Two sets of forecasts for 500 households are made Note that the physical unit is presumed to be kiloWatt.
- 3-step forecasts based on daily profile, done by integrated SARIMA (with AR1, MA1 and weekly seasonal AR1), in a comma-separated CSV file
- 4-step forecasts based on hourly profile, done by Facebook
Prophet, in another comma-separated CSV file